Preface
化学老师学校里要开课,遂给了我二十五个元素信息,让我整张看起来牛逼的元素周期表。
思路
- 数据分析
- 两两维度寻找相关性(较为失败)
- 找出三个维度进行绘图(直接瞎搞)
结果

实现
import matplotlib.pyplot as plt
import numpy as np
from mpl_toolkits.mplot3d import Axes3D # 空间三维画图
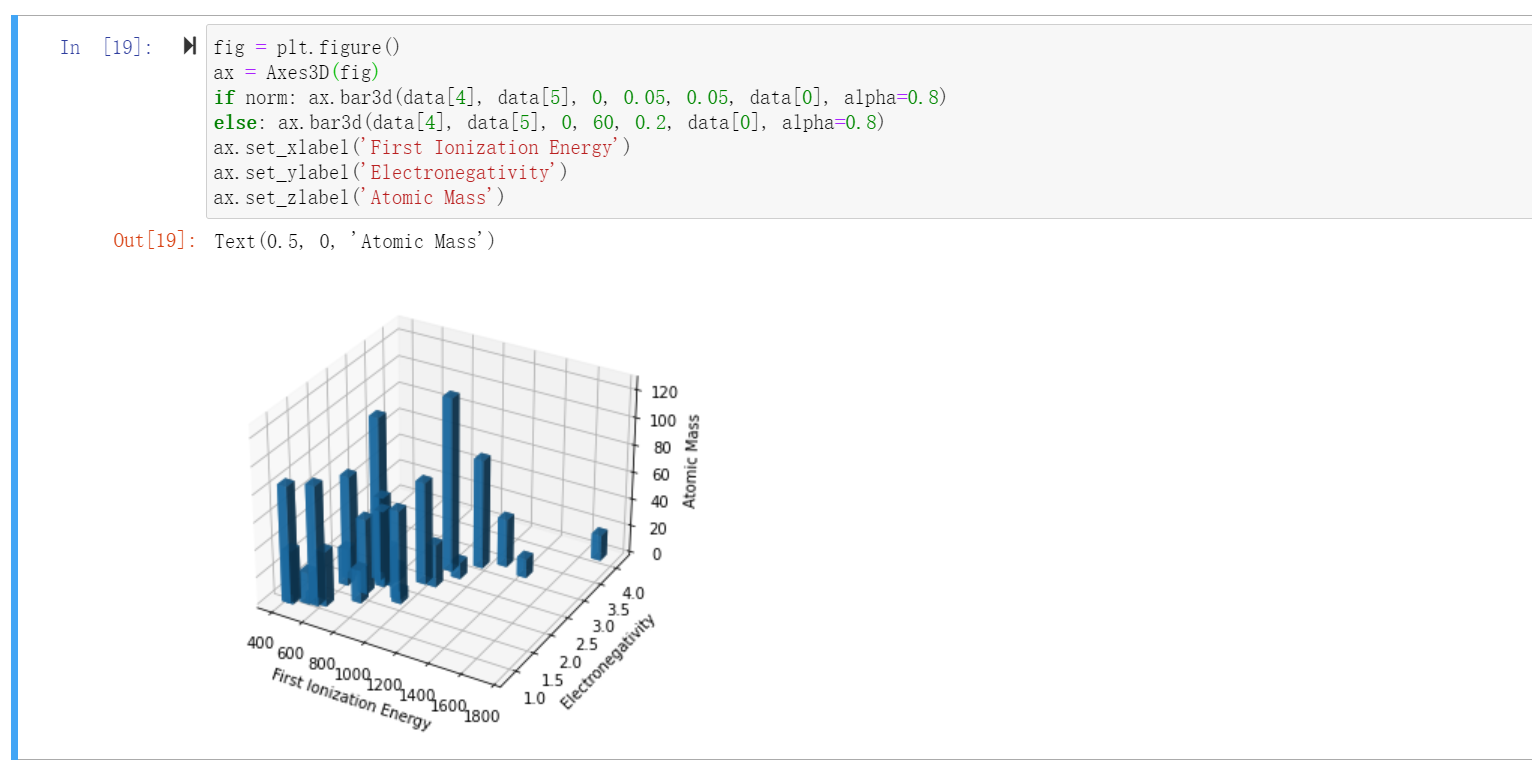
fig = plt.figure()
ax = Axes3D(fig)
ax.bar3d(X, Y, bottom, width, height, Z, shade=True)
ax.set_xlabel('X Label')
ax.set_ylabel('Y Label')
ax.set_zlabel('Z Label')